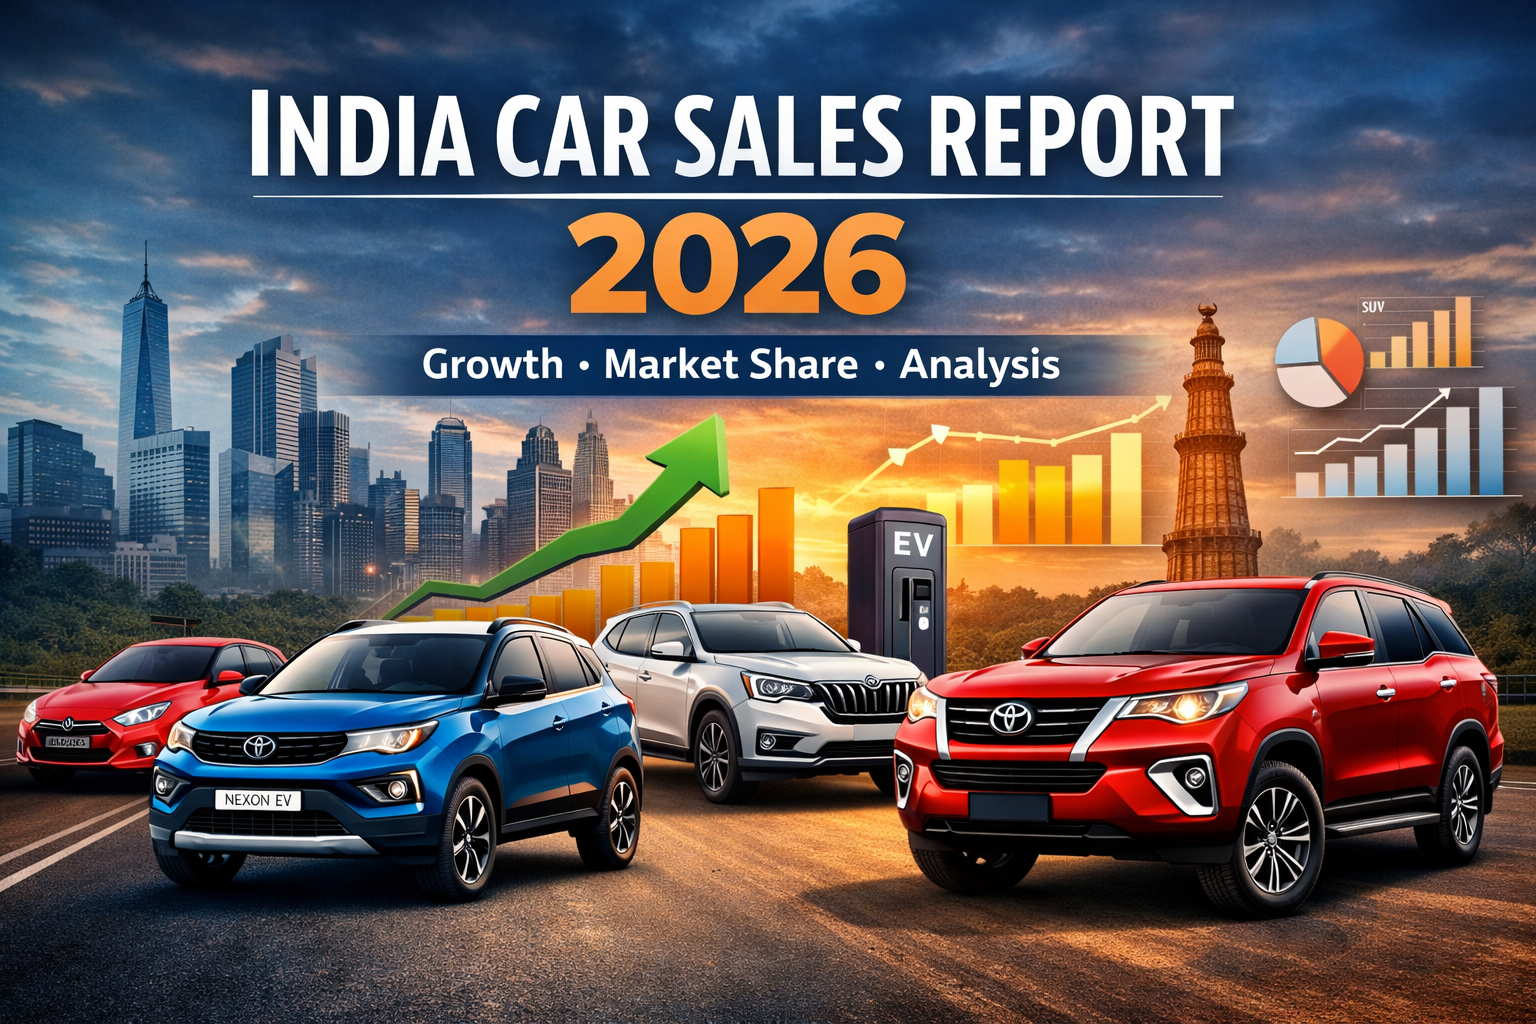
India’s car market in 2026 is best understood through numbers, but raw numbers alone don’t tell the full story. When you layer growth rates, segment mix, and demand quality, patterns start to emerge that are far more important than headline sales.
This report combines brand-level data, segment trends, and underlying structural signals to give a clearer picture of what is really happening.
Total Market Performance (February 2026)
The Indian passenger vehicle market continued its upward trajectory, but with uneven momentum across segments and brands.
| Metric | February 2026 | February 2025 | Growth |
|---|---|---|---|
| Total PV Sales | ~4,20,523 units | ~3,80,689 units | +10.4% YoY |
| Retail Sales | 3,94,768 units | 3,13,015 units | +26.1% YoY |
| Growth Driver | SUVs | — | Dominant |
What stands out here is the gap between retail growth (26%) and wholesale growth (~10%). This indicates that previous inventory is being cleared, and actual demand is stronger than dispatch data suggests.
Brand-Wise Sales Data (Core Market Structure)
This is the most important table, it defines the competitive landscape.
| Brand | Feb 2026 Sales | Feb 2025 Sales | YoY Growth |
|---|---|---|---|
| Maruti Suzuki | 164,130 | 163,501 | +0.4% |
| Tata Motors | 103,222 | 77,232 | +33.7% |
| Mahindra | 84,603 | 72,865 | +16.1% |
| Hyundai | 52,407 | 47,727 | +9.8% |
| Toyota | ~30,737 | ~26,414 | Positive |
| Kia | 27,610 | 25,026 | +10.3% |
| Honda | 5,629 | 5,616 | ~Flat |
| MG Motor | 4,957 | 4,002 | +23.9% |
Interpretation
This table reveals a critical shift:
- Maruti is stable but not growing
- Tata is scaling aggressively
- Mahindra is consistently expanding
- Hyundai is growing, but slower than rivals
The real competition is no longer about who is first, it is about who is gaining share.
Market Share Shift (Who Is Actually Winning)
Sales numbers alone can be misleading. Market share shows real power shifts.
| Brand | Estimated Market Share 2025 | 2026 Trend |
|---|---|---|
| Maruti Suzuki | ~42% → ~38% | Declining |
| Tata Motors | ~13% → ~15% | Rising fast |
| Mahindra | ~12% → ~14% | Rising |
| Hyundai | ~13% → ~12.5% | Slight decline |
| Toyota | ~6% → rising | Gradual gain |
(Compiled from multiple sales reports and trends)
Interpretation
Even when Maruti sells the most cars, it is losing relative dominance.
Tata and Mahindra are the real gainers in structural terms.
Model-Level Data (What People Are Actually Buying)
Looking at brands is not enough, individual models reveal demand patterns.
| Rank | Model | Feb 2026 Sales | YoY Growth |
|---|---|---|---|
| 1 | Tata Nexon | 19,430 | +27% |
| 2 | Maruti Dzire | 19,326 | +32% |
| 3 | Tata Punch | 18,748 | +29% |
| 4 | Hyundai Creta | 17,938 | +10% |
| 5 | Maruti Brezza | 17,863 | +16% |
Interpretation
Out of top 5:
- 4 are SUVs or SUV-like vehicles
- Only 1 sedan survives (Dzire)
This is the clearest proof that SUV dominance is not a trend, it is the market itself now.
Segment-Level Growth (Where the Market Is Moving)
| Segment | Growth Contribution |
|---|---|
| SUVs / UVs | 80%+ of total growth |
| Hatchbacks | Declining |
| Sedans | Flat / niche |
Interpretation
This is the most important structural shift:
- Growth is concentrated in one segment
- Entire market expansion depends on SUVs
Any brand weak in SUVs is automatically at a disadvantage.
Demand Quality Indicators (Hidden but Critical Data)
These are the metrics most blogs ignore.
6.1 Retail vs Wholesale Gap
| Type | Feb 2026 |
|---|---|
| Retail Sales | 3.94 lakh |
| Wholesale Dispatch | ~4.2 lakh |
Insight:
Retail is catching up → demand is real, not just inventory push.
6.2 Rural vs Urban Growth
| Market | Growth |
|---|---|
| Rural | +34.2% |
| Urban | +21.1% |
Insight:
Rural India is now a major growth engine again, especially for compact SUVs.
Brand Strength vs Growth Quality
This table goes beyond raw numbers and evaluates sustainability.
| Brand | Growth Type | Dependency | Demand Quality |
|---|---|---|---|
| Maruti | Volume-driven | High discounts | Medium |
| Tata | Share gain | Low | Strong |
| Mahindra | Demand-led | Very low discounts | Very strong |
| Hyundai | Balanced | Medium | Moderate |
| Toyota | Profit-led | Low | Strong |
| Kia | Product-cycle | Medium | Volatile |
| Honda | Declining | High | Weak |
Interpretation
- Mahindra has the healthiest demand
- Tata has the strongest momentum
- Maruti has scale but weakening control
EV and Future Tech Data
| Metric | Value |
|---|---|
| EV Growth FY26 | ~20% expected |
| EV YoY Growth (Feb) | ~45% |
| Market Share | Still low |
Interpretation
EVs are not yet volume drivers, but they are:
- Influencing brand perception
- Driving future investments
Key Structural Insight Table (Most Important Summary)
| Factor | What Data Shows | Real Meaning |
|---|---|---|
| SUV Share | Dominates growth | Market shift complete |
| Maruti Growth | Flat | Losing relevance in new segments |
| Tata Growth | 30%+ | Aggressive share capture |
| Mahindra Demand | High waiting periods | Strong organic demand |
| Hyundai | Stable | Identity problem |
| EV Growth | High % but low base | Future positioning battle |
If you remove noise and look only at data, three truths emerge:
- The Indian market is no longer volume-led, it is SUV-led and value-led
- Growth is concentrated among a few players, mainly Tata and Mahindra
- Legacy leadership (Maruti) is being challenged structurally, not temporarily
The most important takeaway is this:
The winners of the next phase will not be the companies selling the most cars today,
but the ones aligned with where demand is going.